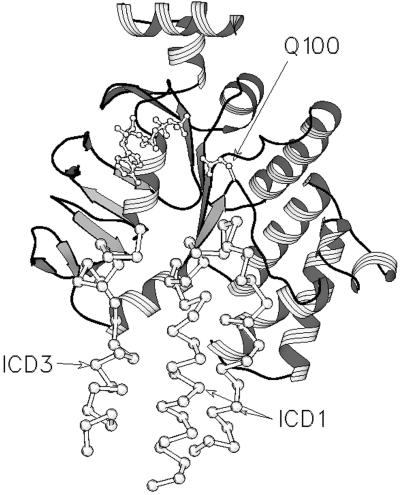
Figure 5.
Structural alignment of the HisP structure (1B0U) with that of MsbA (1JSQ). The alignment was performed with SWISS PDBVIEWER by using the “best fit with structural alignment” option. HisP is depicted as a ribbon diagram. The bound ATP, the side chain of Q100 in HisP, and the Cα backbone of MsbA are drawn in ball and stick representation. Only the regions of ICD1 and ICD2 of MsbA that are proximal to the NBD are shown.

