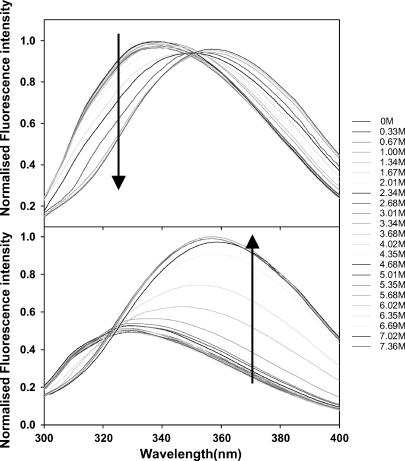
FIGURE 5.
Fluorescence emission spectra of SBA and ConA in different GdnCl concentrations (0–7.5 M range). The gradient is indicated by an arrow near the wavelength, which was used to monitor the isothermal melts. All the curves are equally spaced with respect to Gdncl concentration. The spectra are normalized to the highest intensity.

