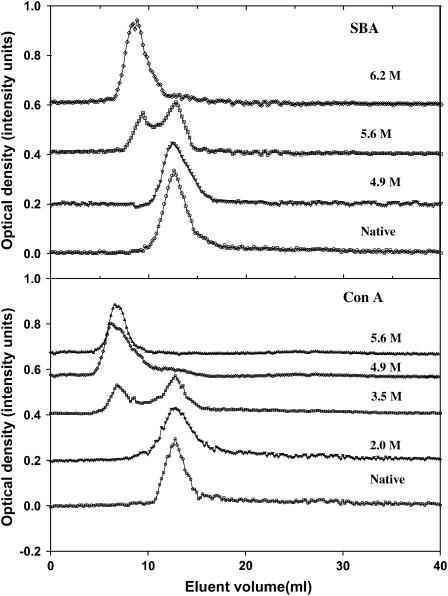
FIGURE 6.
Gel filtration profiles of SBA and ConA at different GdnCl concentrations. The denaturant concentration is indicated at the side of each profile. The protein concentrations used were 40 μM in each case. The optical densities were taken at 280 nm. The column used was a P-150 Biogel column (40 ml bed volume; void volume was 11 ml as determined by blue dextran). The flow rate was maintained at 5 ml/h throughout the experiment. The gel filtration was conducted at 293 K. During the experiment the column volume changed at the most by 0.75 ml at 3.5 M GdnCl, 2 ml at 4.9 M GdnCl, and 2.7 ml at 6.2 M GdnCl. Each time the elution volume was normalized with respect to the starting column volume.

