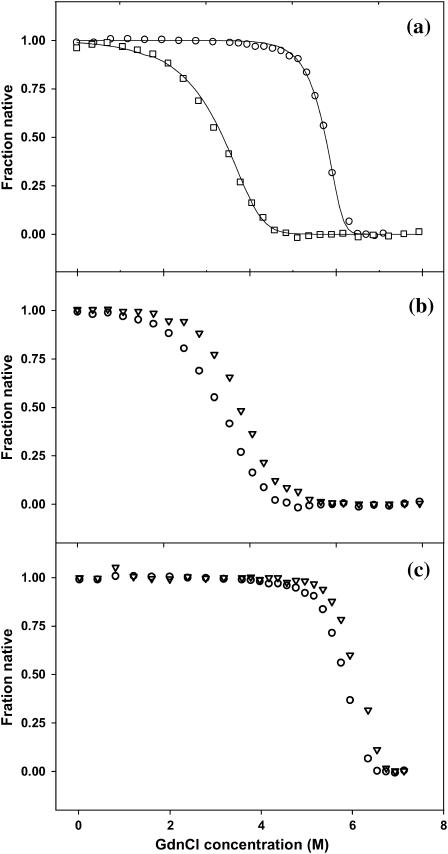
FIGURE 8.
(a) GdnCl-induced unfolding of SBA (○) and ConA (□) at 298 K. The solid line passing through the points is the fit of Eq. 7 to the experimental data. (b) Protein concentration-dependent unfolding of ConA at 298 K, (○) 2 μM, and (▽) 10 μM. (c) Protein concentration-dependent unfolding of SBA at 298 K, (○) 2 μM, and (▽) 10 μM.

