FIGURE 4.
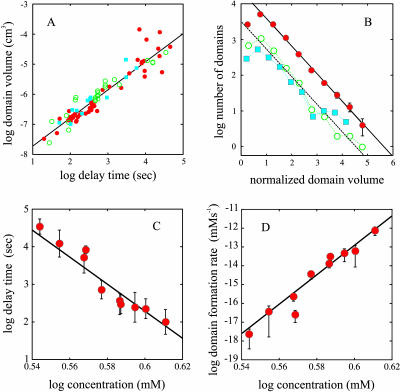
Domain volumes and concentration dependence of delay time and domain formation rate. (A) The mean domain volume from each experiment is shown as a function of the delay time. (•) Data obtained at 303 K at varying Hb S concentrations. (○) Data obtained at 296 K at different Hb S concentrations. (▪) Data obtained at a Hb S concentration of 4.02 mM at temperatures between 287 K and 308 K. (B) Distribution of normalized domain volumes for all of the data (red solid circles), the distribution for the subset of samples with shortest delay times (2498 domains) (open green circles), and the distribution for the subset of samples with the longest delay times (1437 domains) (cyan squares). (C) Delay time versus initial protein concentration. The slope from the linear least squares fit is −41 ± 4. (D) Domain formation rate versus initial protein concentration: slope = 80 ± 7.

