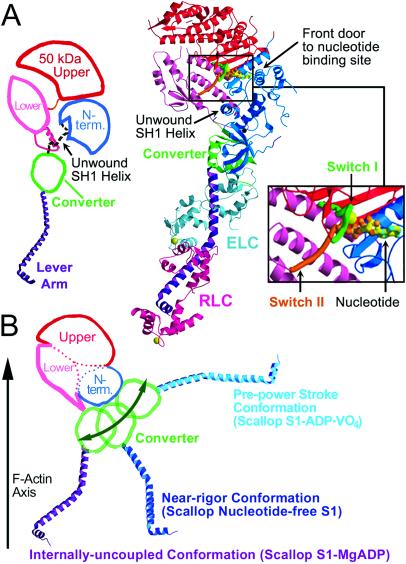
Figure 1.
Overview of the internally uncoupled scallop S1 conformation. (A) (Center) The internally uncoupled S1-ADP⋅BeFx structure (50-kDa upper subdomain is shown in red, 50-kDa lower subdomain is shown in pink, N-terminal subdomain is shown in blue, converter is shown in green, lever arm heavy chain is shown in purple, essential light chain is shown in cyan, regulatory light chain is shown in magenta). Notable features of the structure include the unusual position of the lever arm and the unwound SH1 helix. Three other scallop structures (S1-AMPPNP, S1-ATP[γ-S]-p-PDM, and S1-ADP-p-PDM), as well as the previously reported scallop S1-MgADP (1), show the same conformation, although the orientations of the respective lever arms vary slightly. (Right Inset) Expanded view of the nucleotide binding size. (Left) Schematic diagram of the internally uncoupled conformation, showing the subdomains and the approximate location of the disordered SH1 helix (light chains not shown). (B) For comparison, a two-dimensional projection of the three weak actin-binding S1 conformations observed in scallop crystal structures (light chains not shown) (1, 2). The 50-kDa upper and N-terminal subdomains of the three structures are superimposed to show the large changes in the relative positions of the converter and lever arm (see also ref. 2). In each conformation, the 50-kDa lower subdomain adopts a slightly different position with respect to the 50-kDa upper and N-terminal subdomains, leading to a markedly different orientation of the converter. The converter, in turn, controls the position of the lever arm (1). Movement of the 50-kDa lower subdomain is not represented in this schematic diagram. This subdomain rotates to maintain contact with the converter as S1 adopts each of the three conformations. See Fig. 5 for a more detailed three-dimensional description of the subdomain motions.

