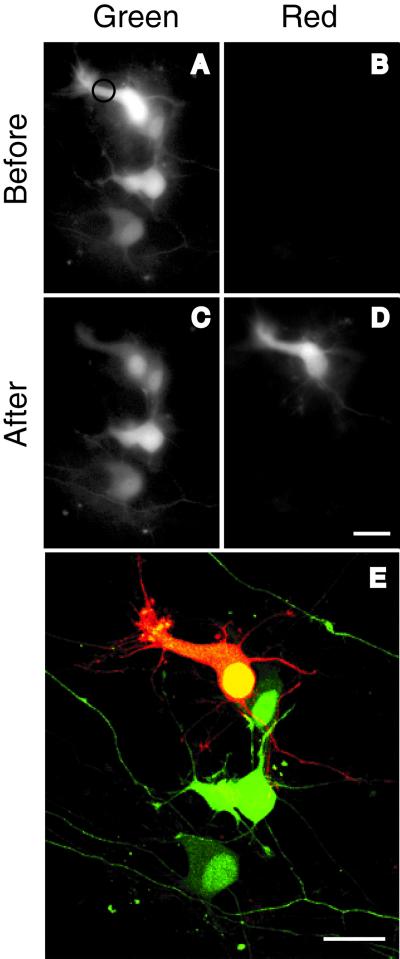
Figure 7.
Visualization of an individual neuron in a hippocampal primary culture. (A and B) One day after transfection with Kaede cDNA, green and red fluorescence images were taken by using the configurations shown in Fig. 5 A and B, respectively. A spot in the cytosolic portion (indicated by a circle) of a neuron was UV-pulsed for 10 s. (C and D) Green and red fluorescence images 3 min after the UV pulse. (E) The red neuron and adjacent green neurons were imaged simultaneously by using confocal microscopy with 488/543-nm excitation and merged. A series of confocal images along z axis are projected. (Scale bar: 20 μm.)

