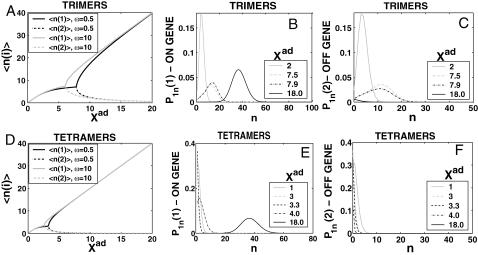
FIGURE 16.
Mean number of proteins in the cell, for each type when proteins bind as trimers (A) and tetramers (D), ω = 0.5, 10, symmetric switch. The evolution of the probability distribution for the probability of the gene that will be active and inactive after the bifurcation to be on as a function of Xad for a switch when proteins bind as trimers (B and C) and tetramers (E and F). Xeq = 1000, ω = 0.5.

