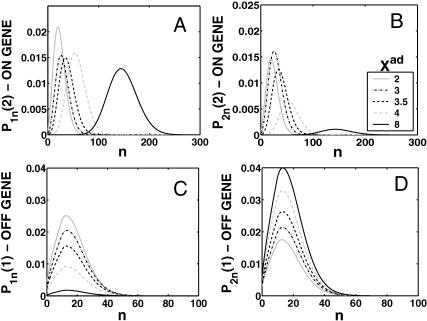
FIGURE 20.
The evolution of the probability distribution of the gene that is active after the bifurcation, to be on (A) and off (B) and the gene that is inactive to be on (C) and off (D) as a function of Xad for a switch when proteins are produced in bursts of N = 10, Xeq = 1000, ω = 100. Bifurcation point at Xad = δXsw = 35.

