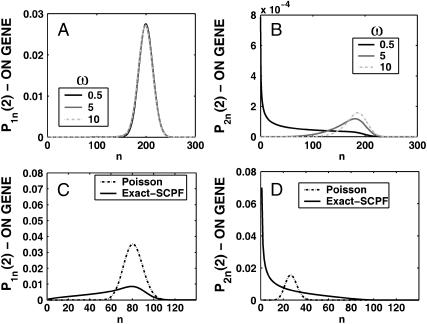
FIGURE 5.
Probability distributions for the gene to be in the on-state (A) and off-state (B) for a gene in the active state for different values of the adiabaticity parameter ω = 0.5, 10, 100. Xeq = 100, Xad = δXsw = 100. Comparison of probability distributions obtained by exactly solving the steady-state equations in the SCPF approximations with analogous Poissonian distributions (C and D). Symmetric switch, Xad = 44, Xeq = 1000, ω = 0.5.

