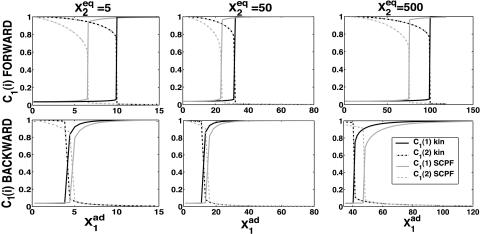
FIGURE 8.
Dependence of the probability of genes to be on in an asymmetric switch as a function of increasing parameters of one gene  in the forward (top) and backward (bottom) transition for different values of
  : 5, 50, and 500. All other parameters fixed at
  and
and  Comparison of solutions of deterministic and exact SCPF equations.

