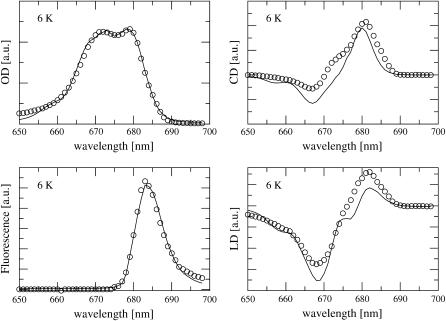
FIGURE 2.
Absorption (OD), circular dichroism (CD), and fluorescence and linear dichroism (LD) spectra of D1–D2 complexes at 6 K. Solid lines show calculations obtained for the optimized site energies given in Fig. 1. Circles are the experimental data (Germano et al., 2001, 2000).

