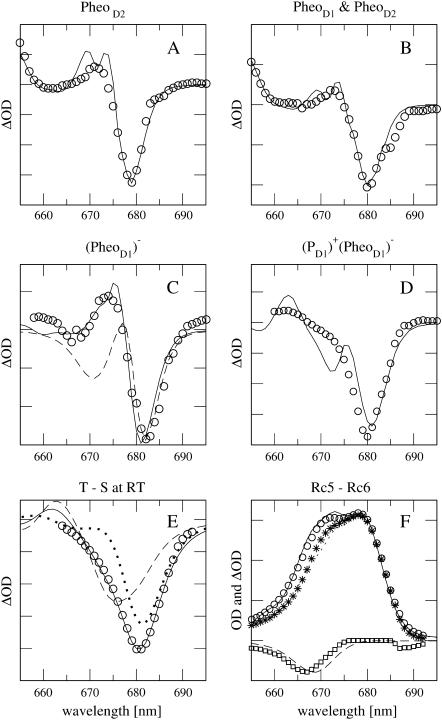
FIGURE 5.
(A) 5-K absorption difference spectrum with modified PheoD2. Solid line is calculation; circles are experimental values (Germano et al., 2001). (B) 5-K absorption difference spectrum with modified PheoD1 and PheoD2. Solid line is calculation; circles are experimental values (Germano et al., 2001). (C) 77-K absorption difference spectrum with reduced PheoD1. Solid line is calculation, circles are experimental values (Vacha et al., 2002), and dashed line shows calculation without electrochromic shifts. (D) Calculation (solid line) of 10-K absorption difference spectrum with reduced PheoD1 and oxidized PD1, comparison with experimental data (van Kan et al., 1990). (E) 277-K T-S spectrum, circles are experimental values (Durrant et al., 1990), dotted line shows calculation for triplet localized at AccD1, dashed line for triplet localized at PD1, and solid line for a mixture of both according to a thermal population of triplet states (for details, see text). (F) 77-K absorption and difference spectra of RC-6 and RC-5 preparations (for explanation, see text). Solid (RC-6) and dotted (RC-5) lines are calculations, triangles, and circles are experimental values (Vacha et al., 1995); dashed line and squares are theoretical and experimental difference spectra, RC-5−RC-6.

