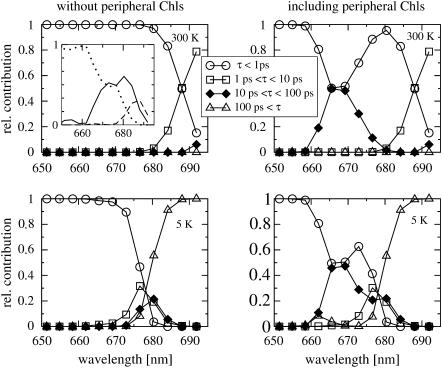
FIGURE 8.
Calculation of disorder averaged exciton lifetimes at 6 K (top) and at room temperature (bottom). (Left) For the six core pigments; (right) including also the two peripheral chlorophylls ChlzD1, ChlzD2. Inset (top left) shows subpicosecond lifetimes: τ < 100 fs (dotted line), 100 fs < τ < 500 fs (solid line), and 500 fs < τ < 1 ps (dashed line).

