
FIGURE 10.
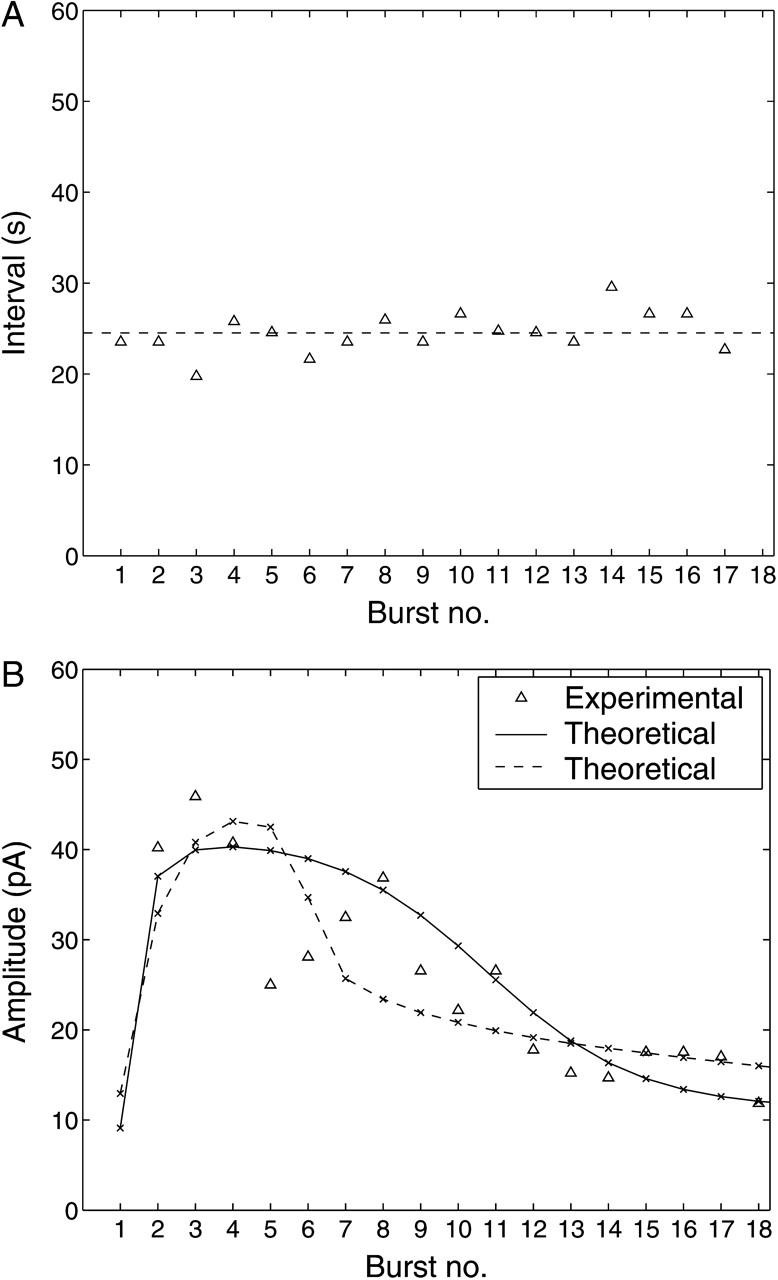
Experimental results (▵) for the time between bursts (A) and amplitudes of bursts (B) of STOCs after application of 10 μM of UTP to an A7r5 cell. In A the dashed line shows the average value of the intervals which is used to specify the bursting interval for the theoretical model. In B the solid line gives the theoretical amplitudes obtained by solving the model equations using the theoretical cytosolic Ca2+ fluorescence (Fig. 6, solid curve) as input; the crosses indicate the locations of the peaks. The experimental data-point is not given for burst 1 because of an artifact shortly after the addition of UTP. The broken line in B gives the corresponding theoretical results when the experimental cytosolic Ca2+ fluorescence (Fig. 6, dotted curve) is used as input (see the Appendix for modifications to the theory); the remaining parameters are as in Table 1, except that wdom has been increased to 4 × 10⁻³.