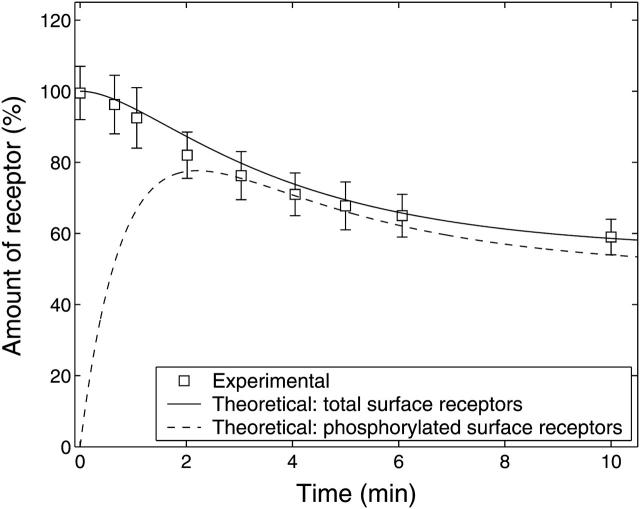
FIGURE 5.
Experimental and theoretical membrane P2Y2 receptor fraction with respect to time. Experimental data show the time-course of P2Y2-GFP in A7r5 cells (squares with mean ± SE for six cells) after application of 10 μM UTP at t = 0. The P2Y2-GFP fluorescence has been taken to be proportional to the number of receptors in the membrane and has been scaled to become a percentage of the amount of receptor relative to that before agonist stimulation. The solid line is the theoretical time-course of the total surface receptor fraction,  and the broken line is the time-course of the phosphorylated surface receptor fraction,
  both obtained by solving Eqs. 1 and 2.

