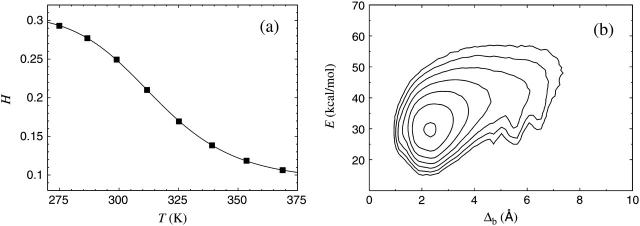
FIGURE 2.
The Trp cage. (a) Helix content against temperature. The line is a fit to Eq. 9 (Tm = 315 K, ΔE = 11.5 ± 0.2 kcal/mol). Statistical errors are smaller than the plot symbols. (b) Contour plot of the free energy F(Δb, E) at 275 K. The contours are spaced at intervals of 1 kT. Contours more than 6 kT above the minimum free energy are not shown. The free energy F(Δb, E) is defined by exp [ − F(Δb, E)/kT] ∝ P(Δb, E), where P(Δb, E) denotes the joint probability distribution of Δb and E at temperature T.

