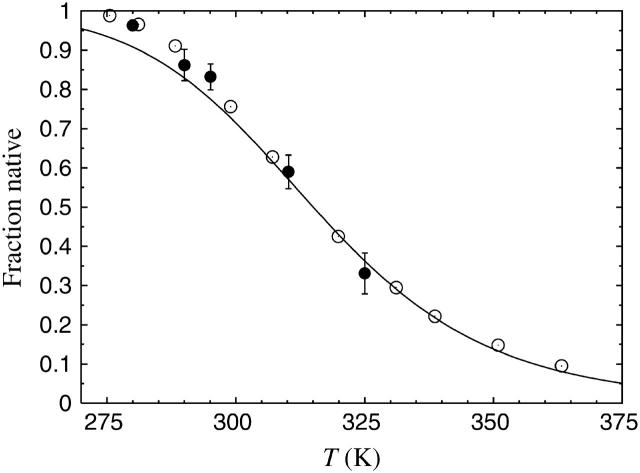
FIGURE 3.
Native population against temperature for the Trp cage. The line is the result obtained from the model, through the fit shown in Fig. 2 a. Plot symbols show experimental results (Neidigh et al., 2002) based on CD (○) and NMR (•), respectively.

