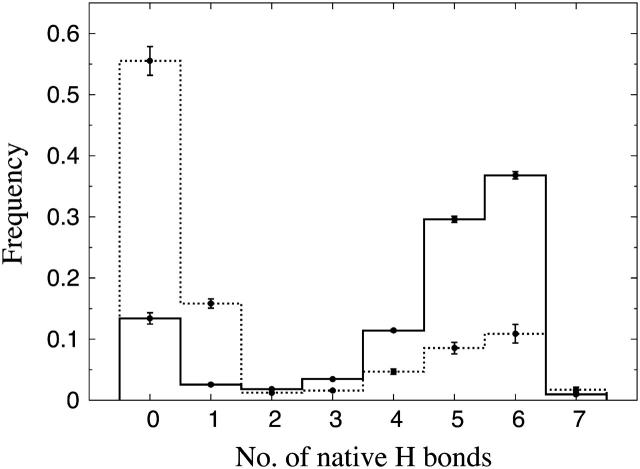
FIGURE 7.
Probability distribution of the number of native hydrogen bonds,  , for GB1m3 (solid line) and GB1p (dotted line) at 299 K. The hydrogen bonds taken as native are the same for both peptides. In GB1p notation, the native hydrogen bonds are Glu42(N)-Thr55(O), Glu42(O)-Thr55(N), Thr44(N)-Thr53(O), Thr44(O)-Thr53(N), Asp46(N)-Thr51(O), Asp46(O)-Thr51(N), and Asp47(O)-Lys50(N).

