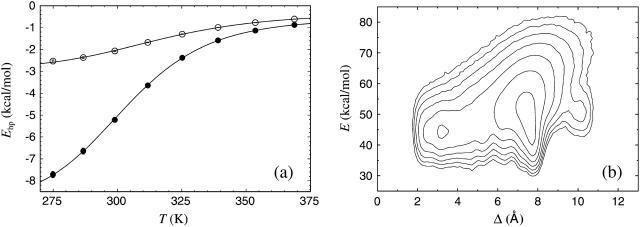
FIGURE 9.
(a) The hydrophobicity energy Ehp against temperature for Betanova (○) and LLM (•). The lines are fits to Eq. 9 (Tm = 314 ± 1, ΔE = 8.9 ± 0.1 kcal/mol for Betanova; Tm = 302 ± 1 K, ΔE = 10.9 ± 0.2 kcal/mol for LLM). (b) Free energy F(Δ,E) for Betanova at 275 K. Contour levels are as in Fig. 2 b.

