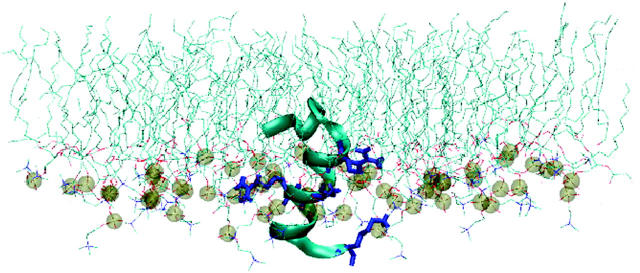
FIGURE 13.
Snapshot of the simulation MUT5 at 10 ns. The peptide is shown as ribbons. The DPPC lipid is drawn as lines. The charged amino acids are depicted as blue bonds. The phosphorus atoms of the lipid molecules are drawn as spheres to clarify the approximate position of the interface. Water molecules are not shown. Observe that all the charged amino acids are in the lipid/water interface region, leading to a large number of hydrogen bonds and a stable peptide secondary structure and relative orientation.

