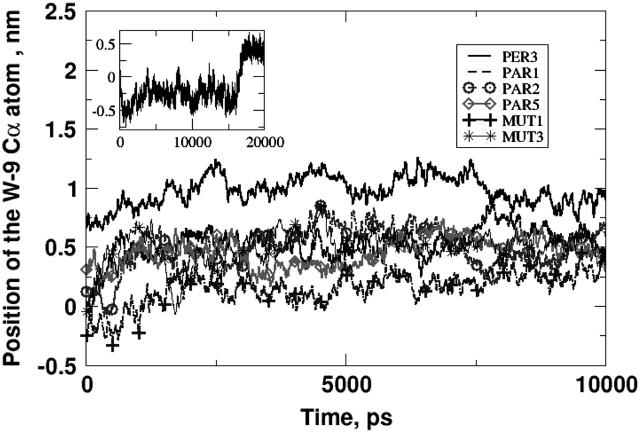
FIGURE 14.
The average position of the backbone carbon of the tryptophan residue in some of the simulations. Zero on the y axis represents the average position of the lipid phosphorus atoms. A positive value corresponds to a deeply inserted position (closer to the lipid tails) and a negative value corresponds to a shallower position (closer to the water subphase). The general trend is for the tryptophan residue to reside ∼5 Å above the phosphorus plane. The inset shows the longer PER1 simulation.

