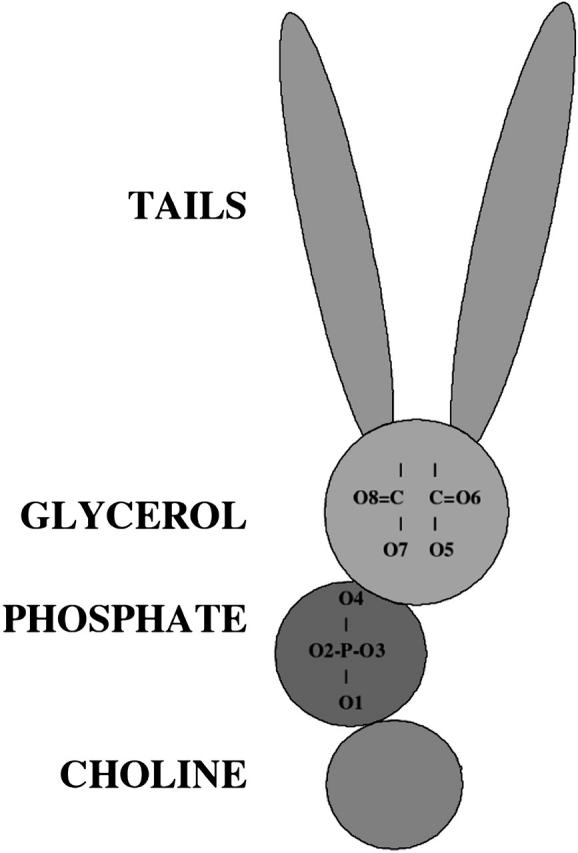
FIGURE 4.

A schematic representation of the lipid, showing the tail, glycerol, phosphate, and choline regions. The oxygens in the phosphate and glycerol region, which are the hydrogen-bond acceptor sites, are numbered, and these indices are used in the discussion of hydrogen-bonding statistics.
