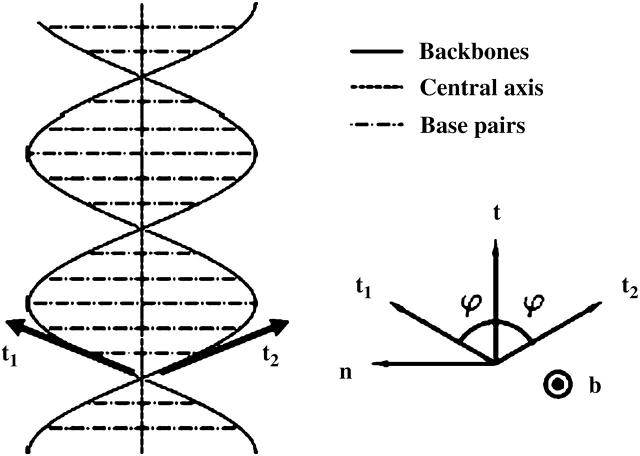
FIGURE 3.
Schematic representation of the DNA model used to describe its elongation and untwisting during the B-Z transition. The right portion of the figure demonstrates the local definition of the folding angle ϕ. t is the tangential vector of the central axis. Each basepair is treated as a rigid rod of length 2R pointing along a direction denoted by b.  (Figure adapted from Zhou et al., 2000.)

