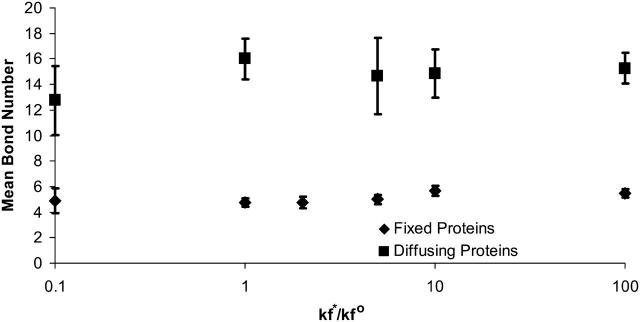
FIGURE 10.
Mean bond number as a function of the intrinsic on-rate for bond formation,  compared to the experimentally observed value,
  found in Table 1. Data represented by diamonds and squares correspond to where the proteins are fixed and mobile, respectively. There is no effect on changing
  on the mean bond number at steady state. Allowing the proteins to diffuse increases the mean bond number. Protein diffusivity was set to 10−10 cm2/s.

