
FIGURE 7.
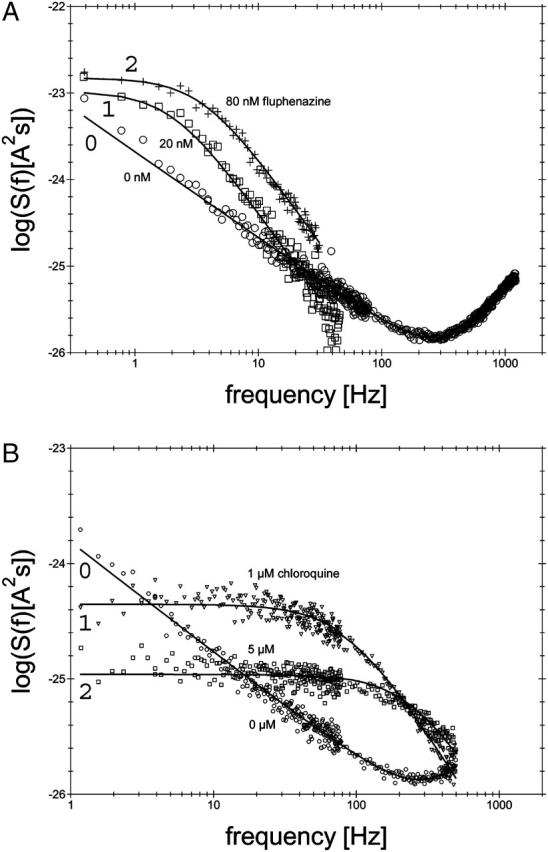
(A) Power density spectra of fluphenazine-induced current noise of ∼1600 PA63-channels (added only to the cis-side of the membrane). Trace 0 shows the control (150 mM KCl). (Trace 1) The aqueous phase contained 20 nM fluphenazine and the power density spectrum of trace 0 was subtracted (τ = 79.6 ms;  = 10.43 × 10⁻²⁴ A2s). (Trace 2) The aqueous phase contained 80 nM fluphenazine and the power density spectrum of trace 0 was subtracted (τ = 45.2 ms;
  = 14.9 × 10⁻²⁴ A2s); T = 20°C;
  = 10 mV. (B) Power density spectra of chloroquine-induced current noise of ∼1400 PA63-channels (added only to the cis-side of the membrane). Trace 0 shows the control (150 mM KCl). (Trace 1) The aqueous phase contained 1 μM chloroquine and the power density spectrum of Trace 0 was subtracted (τ = 1.77 ms;
  = 0.44 × 10⁻²⁴ A2s). (Trace 2) The aqueous phase contained 5 μM chloroquine and the power density spectrum of trace 0 was subtracted (τ = 0.63 ms;
  = 0.11 × 10⁻²⁴ A2s); T = 20°C;
  = 10 mV.