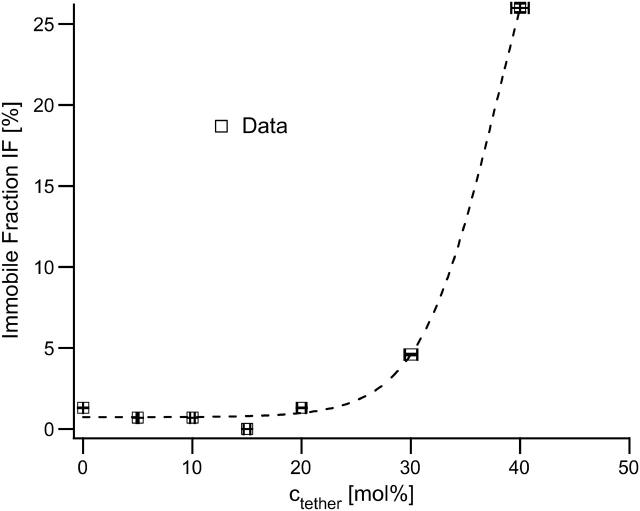
FIGURE 3.
Fraction of immobile tracks IF obtained from the single molecule tracking of fluorescently labeled phospholipid TRITC-DHPE incorporated into the inner leaflet of the polymer-tethered SOPC bilayer plotted versus ctether. This plot shows the typical feature of a percolating system—almost all molecules are mobile below the percolation threshold with a sudden increase in the immobile fraction very close to the percolation point. The dashed line is no model fit, but only highlights the strongly asymptotic behavior.

