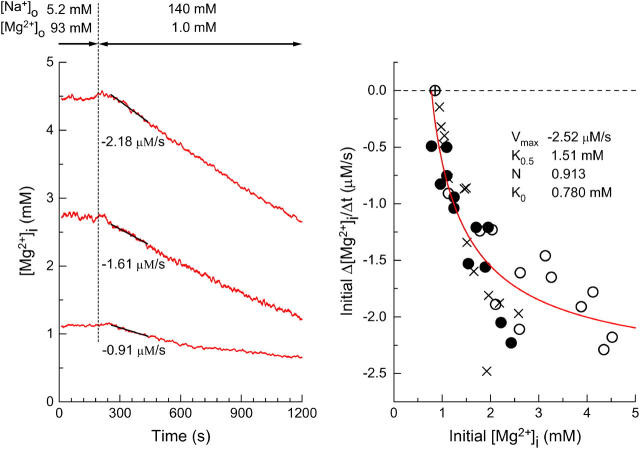
FIGURE 2.
(Left) Estimation of the initial rates of decrease in [Mg2+]i in three myocytes which were loaded with Mg2+ to different levels of [Mg2+]i. After the Mg2+ loading in the high-Mg2+ and low Na+ solution, Ca2+-free Tyrode's solution was introduced to induce Mg2+ efflux, as indicated at the top. Cells 051203 (top), 060303 (middle), and 062403 (bottom). (Right) Values of the initial Δ[Mg2+]i/Δt estimated as shown in the left panel are plotted as a function of initial [Mg2+]i (defined as [Mg2+]i at the first point of the fitted line). The myocytes were loaded with Mg2+ in solutions containing either 93 mM Mg2+ (open circles) or 24 mM Mg2+ (solid circles) for 2–5 h. Mean basal [Mg2+]i measured before Mg2+-loading in these myocytes was 0.855 mM (n = 23), and is plotted at zero initial Δ[Mg2+]i/Δt (⊕). Also shown (x symbols) are data taken from Figs. 4 and 6 of Tashiro et al. (2002); the myocytes were loaded with Mg2+ in the 93 mM Mg2+-containing solution, and the initial Δ[Mg2+]i/Δt values were estimated under voltage-clamp at the holding potential of −80 mV. A solid curve indicates the least-squares fit to the data points (open circles and solid circles) by the Hill-type curve (Eq. 2) with the parameters shown in the panel.

