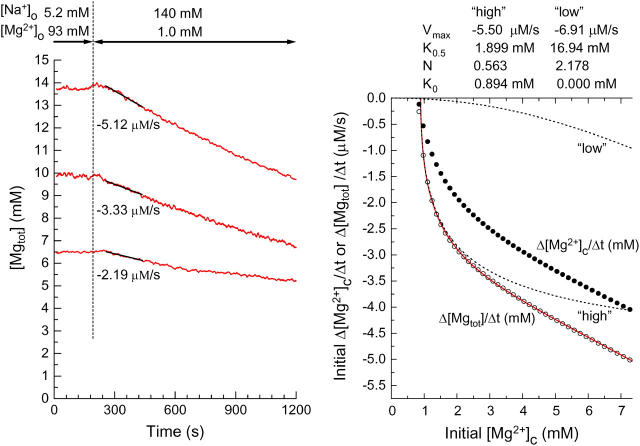
FIGURE 9.
The left panel shows analysis of the initial rates of decrease in [Mgtot] (initial Δ[Mgtot]/Δt) in three myocytes which were loaded with Mg2+ to different levels of [Mg2+]c (the same cells as used for the analysis in the left panel of Fig. 2). The initial Δ[Mgtot]/Δt (the slopes of solid lines) estimated by linear regression to [Mgtot] traces for 180 s (60–240 s after solution exchange) are indicated below the traces. The right panel compares initial Δ[Mgtot]/Δt (open circles) and initial Δ[Mg2+]c/Δt (solid circles) calculated through Steps 1–7 (see Appendix for details). A solid curve indicates the least-squares-fit to open circles by sum of the two Hill-type curves (see Eq. 2): two dotted curves marked “high” and “low” with the best-fitted parameter values are shown at the top of the panel.

