
FIGURE 1.
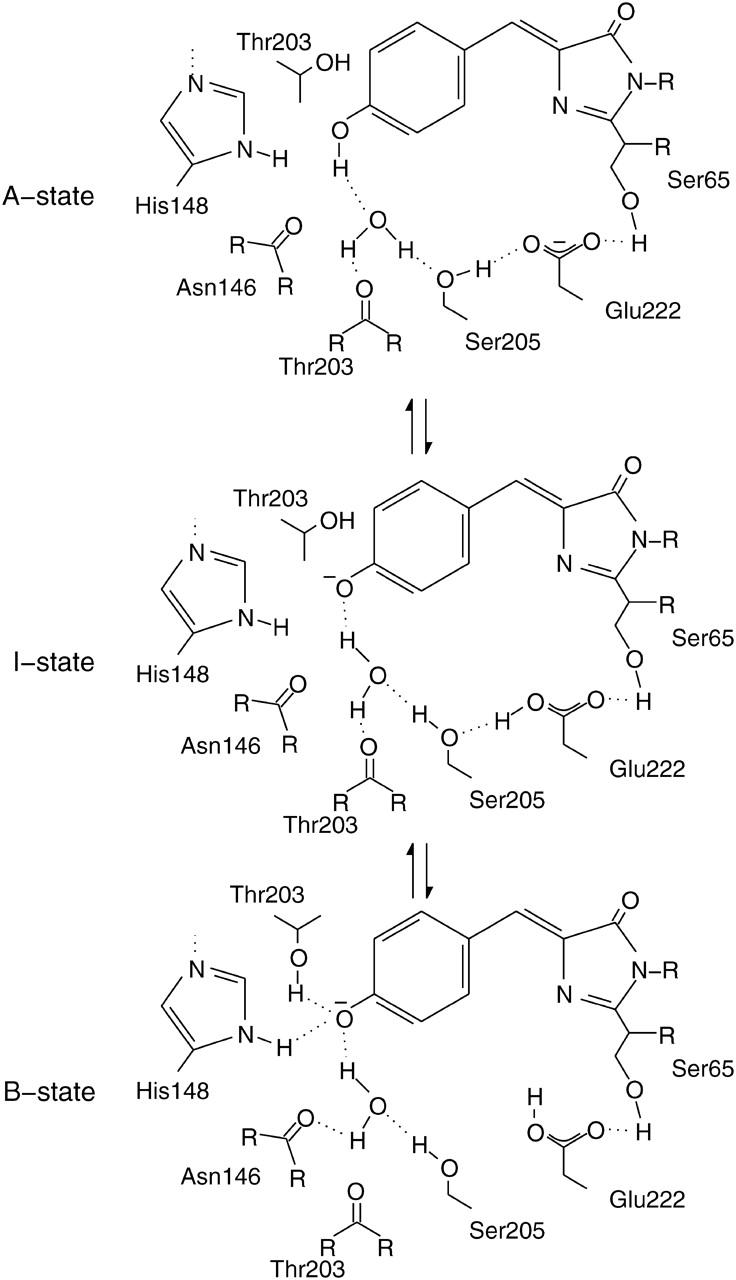
Model of the GFP chromphore in its three different states, A, B, and I (Brejc et al., 1997). Mutations in the surrounding hydrogen-bonding network influence the equilibrium between these states and are therefore responsible for spectral shifts observed in the absorbance and fluorescence spectra.