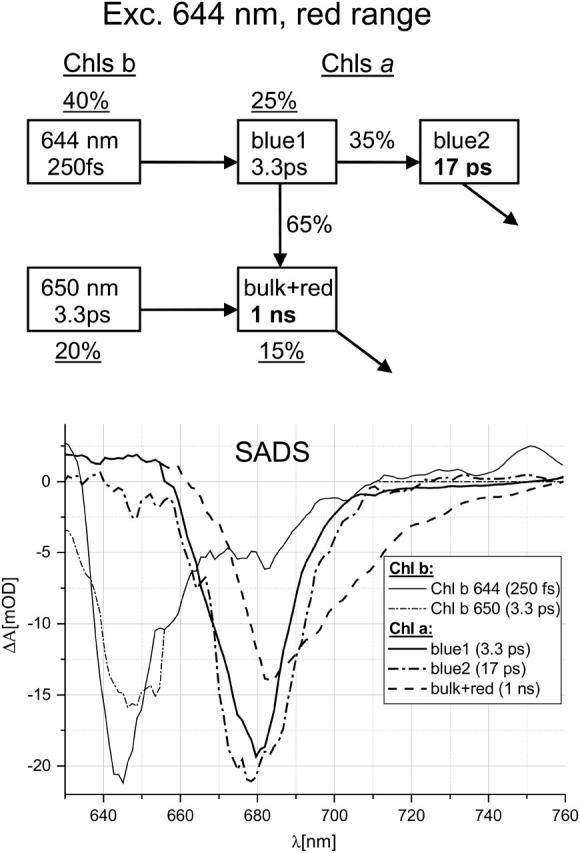
FIGURE 5.

Scheme of compartments and SADS for 644-nm excitation in Lhca4 in the red spectral range. The meaning of the numbers is as in Fig. 3. Underlined numbers denote distribution of initial excitation over particular compartments. Spectral shapes of Chl b-644 and Chl b-650 were forced to be identical between 655 and 710 nm and, additionally, spectrum of Chl b-650 was forced to have zero amplitude above 710 nm. Also spectra of Chl a “blue 1” and “bulk + red” were forced to be identical below 655 nm. These reasonable constraints were necessary to get a good fit.
