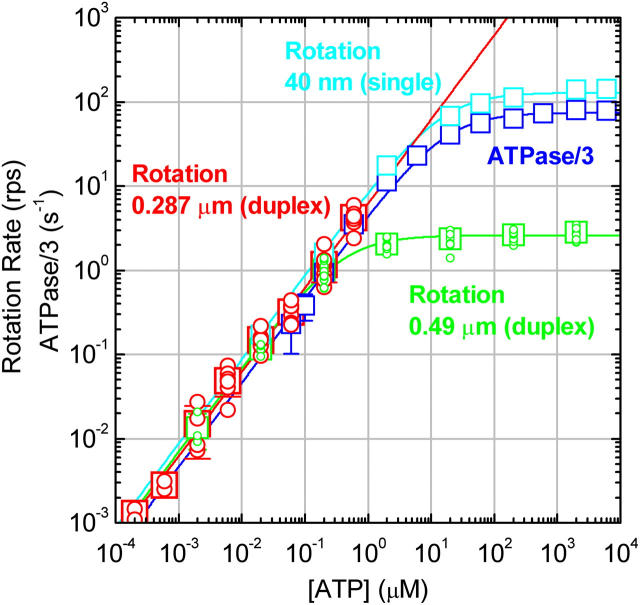
FIGURE 2.
[ATP] dependence of the time-averaged rotation rate v and ATP hydrolysis rate V. Red circles, rotation rates of 0.287-μm bead duplexes with their average shown in red squares; red line, a linear fit showing v/[ATP] = (6.2 ± 1.0)×106 revolutions M−1s−1, corresponding to the apparent rate constant for ATP binding,  of 1.9 × 10⁷ M−1s−1. Green circles and green squares, for 0.49-μm bead duplexes; green curve, a Michaelis-Menten fit with v = vmax[ATP]/([ATP]+Km), where vmax = 2.6 ± 0.4 revolutions s−1 and Km = 0.37 ± 0.13 μM, giving
  Red and green circles represent a time-averaged rotation rate over >50 consecutive revolutions (>20 at 2 nM, and >7 at 600 and 200 pM ATP). Error bars, where indicated, show SD that exceeds the size of the symbol. Cyan squares, the average rotation rate for a 40-nm colloidal gold (Yasuda et al., 2001); vmax = 129 ± 27 revolutions s−1 and Km = 15 ± 6 μM, giving
  Blue squares, one third of the average hydrolysis rate for two or three measurements (one at 6 mM ATP), error bars showing SD that exceeds the size of the symbol; blue line, a fit with V = Vmax[ATP]/([ATP]+Km) where Vmax = 223 ± 68 s−1 (without division by three) and Km = 16 ± 8 μM, giving
  Values here are mean ± SE.

