
FIGURE 1.
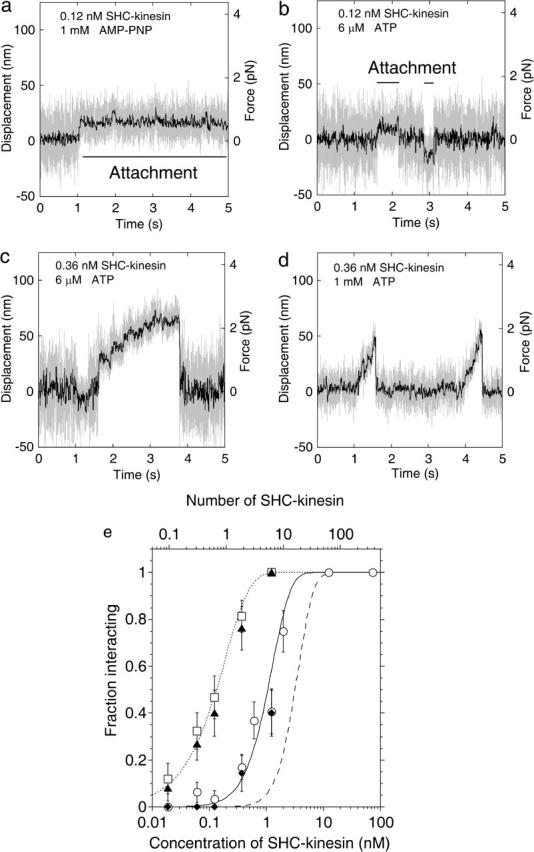
Behavior of the SHC-kinesin. (a–d) Force generation of SHC-kinesin. Data without low pass filter (shaded traces) and having passed through a 50 Hz low pass filter (black traces). Attachment in the presence of 1 mM AMP-PNP (a) and sequential attachment and detachment at 6 μM ATP (b) at SHC-kinesin concentration of 0.12 nM. Continuous movement at 6 μM (c) and 1 mM ATP (d) at SHC-kinesin concentration of 0.36 nM. (e) The ratio of the SHC-kinesin-beads interacting with a microtubule to all beads measured is shown as a fraction of those interacting (vertical axis). In this study, an interacting event is when the variance decreased to half its initial value for longer than 50 ms. Rectangles indicate the ratio of the beads binding to microtubules at 1 mM AMP-PNP. Triangles indicate the ratio of the beads interacting with microtubules at 6 μM ATP. The average number of SHC-kinesin molecules on a bead was calculated by fitting the Poisson distribution (dotted curve) to the data at 1 mM AMP-PNP and is shown on an upper abscissa. The ratios of the beads moving continuously at 1mM ATP and 6 μM ATP are shown in the circles and diamonds, respectively. Error bars are expressed as ±(p(1 − p)/n)1/2, where p is the fraction interacting and n is the number of the measuring beads (n = 19 ∼ 42 at each point; Svoboda and Block, 1994). The moving ratios were simulated when two or more (solid curve) or three or more (dashed curve) SHC-kinesin molecules on a bead interacted simultaneously with a microtubule (see Appendix).