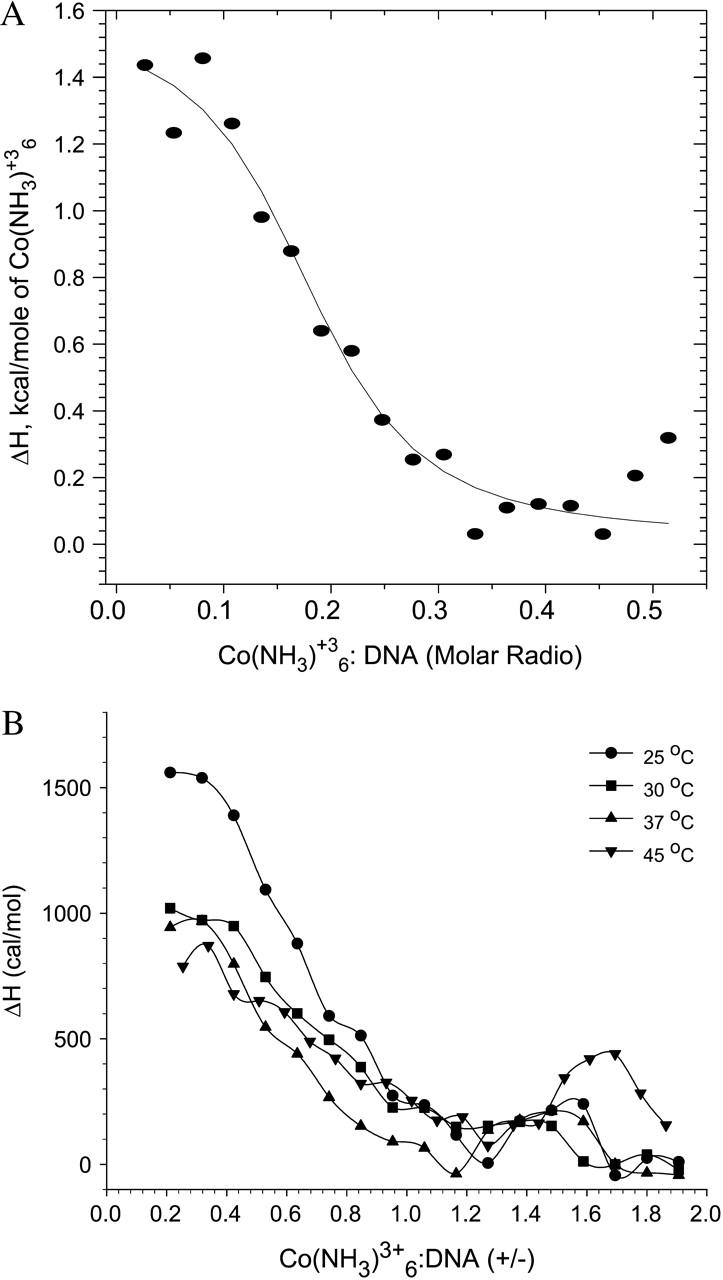
FIGURE 3.

(A) Best nonlinear least-squares fit of the single-site binding model (solid curve) to the cobalt hexammine-DNA binding isotherm (data points) at 25°C; χ2 = 1.5 × 10⁴. Note: abscissa represents [cobalt hexammine]/[DNA] molar ratio. (B) ITC isotherms for cobalt hexammine binding to DNA at different temperatures. Binding proceeds in two stages: i), the pretransition stage yields the ΔH of binding, and ii), the second stage involves an additional enthalpic peak due to DNA collapse. n = 3; average standard errors are 16.3% for 25°C, 24.7% for 30°C, 25.4% for 37°C, and 22.6% for 45°C. Note: abscissa represents cobalt hexammine/DNA (+/−) charge ratio.
