FIGURE 5.

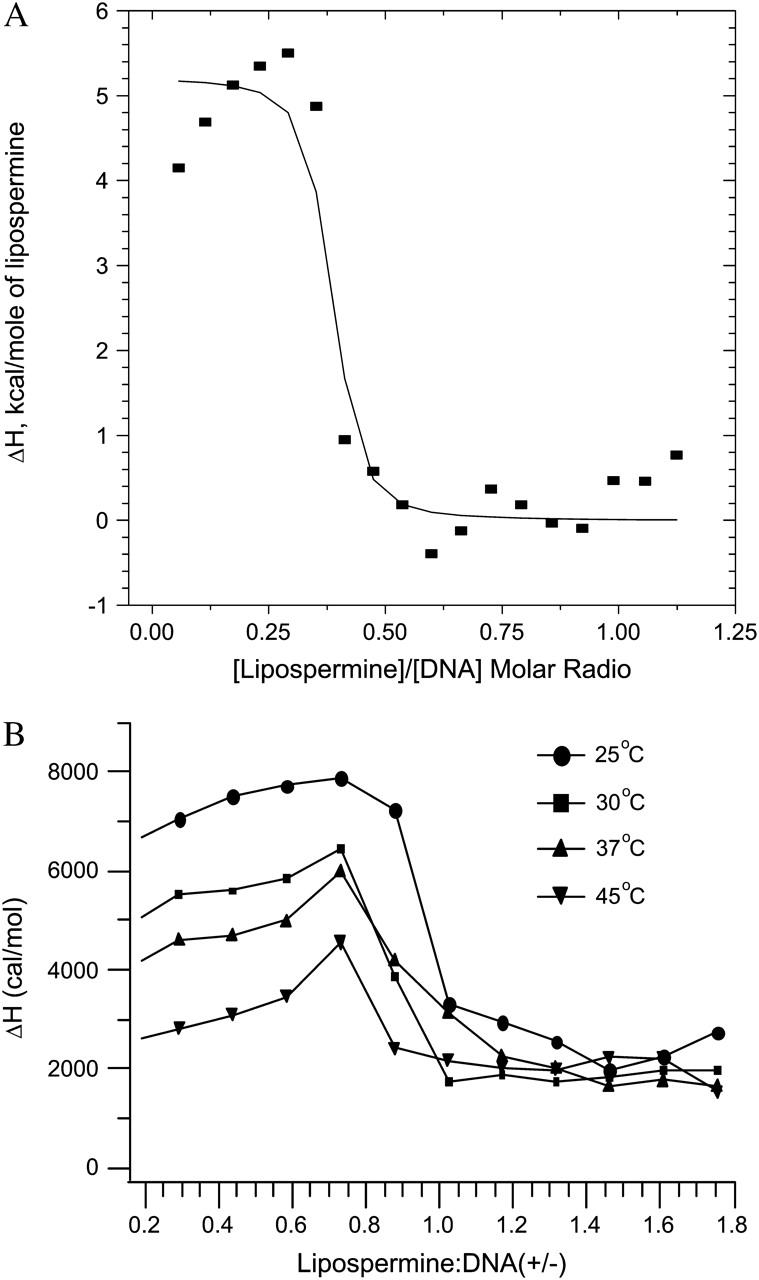
(A) Best nonlinear least-squares fit of the single-site binding model (solid curve) to the lipospermine-DNA binding isotherm (data points), at 25°C; χ2 = 2.99 × 10⁵. Note: abscissa represents [lipospermine]/[DNA] molar ratio. (B) ITC isotherms for lipospermine-DNA binding at different temperatures. The absence of a second endothermic peak suggests that lipospermine does not truly condense DNA. All isotherms yield a nonzero posttransition enthalpy even after subtraction of the dilution heats, suggesting additional interactions between lipospermine and previously formed complexes. The initial increase in the ΔH of binding before DNA saturation at all temperatures is suggestive of positive cooperativity in lipospermine-DNA binding. n = 3; average standard errors are: 8.2% for 25°C, 6% for 30°C, 6% for 37°C, and 9.8% for 45°C. Note: abscissa represents lipospermine/DNA (+/−) charge ratio.
