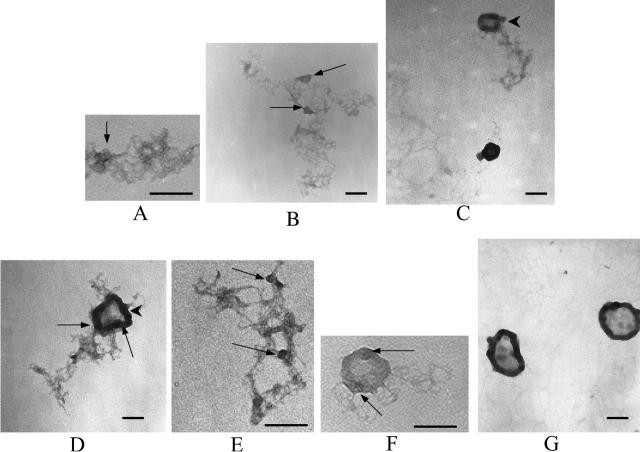
FIGURE 9.
Electron micrographs of lipospermine-DNA complexes at different (+/−) charge ratios: (A) 0.375, (B) 0.5, (C) 1, (D) 1.25, (E) 1.25, (F) 1.5, and (G) 2. Theoretical charge ratios are calculated using +3 for lipospermine and +1 for DNA phosphate. Arrowheads in C and D: collapsed DNA ordered as “tubular” structures; arrows in A, B, D, E, and F: dense regions in the lipospermine-DNA network that persist even at higher [lipospermine]. [DNA] = 1 μg/ml. Bars ∼200 μm.

