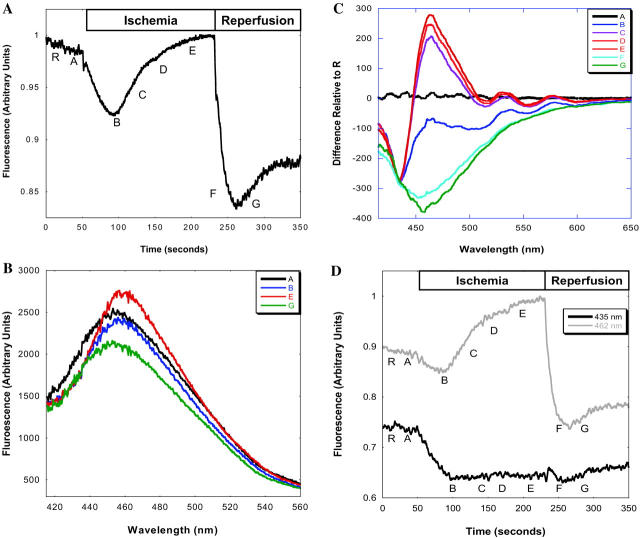
FIGURE 7.
Effect of ischemia/reperfusion on NAD(P)H emission intensity from mouse TA in vivo. (A) Time course of normalized total emission intensity from 380 to 560 nm. The ischemia and reperfusion periods are indicated. Labeled experimental time points are listed as R (reference), A (control), B (early ischemia), C and D (mid-ischemia), E (late ischemia), F (early reperfusion), and G (reperfusion) for indexes to spectral data. (B) Fluorescence spectra from selected time points. (C) Difference spectra performed by subtracting the reference spectrum (R) from the index spectrum. (D) Fluorescence emission time courses (435 and 462 nm) illustrating the different temporal behavior of these two emission wavelengths through the protocol.

