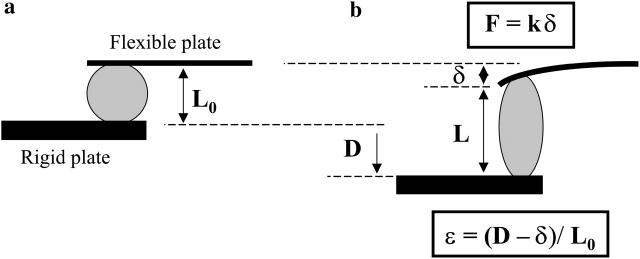
FIGURE 12.
Schematic representation of a constant-rate-of-charge experiment. (a) Initial state with a cell of length L0. (b) The rigid plate is moved at a constant rate (the displacement D is proportional to the time t); both the cell length L(t) and the flexible plate deflection δ(t) are continuously varying and their values are geometrically related.

