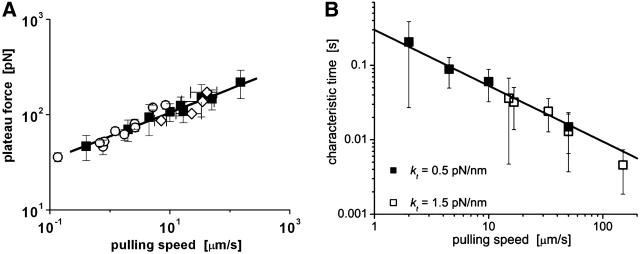
FIGURE 4.
(A) The plateau forces f∞ (solid squares) obtained from fits to each tethering regime are plotted as functions of PMN retraction speed on a log-log scale. The solid line is a power law fit to the BFP data defined by, f∞ ≈ 60pN (vpull/μm/s)0.25. Open circles are data replotted from Shao and Hochmuth (1996). Open diamonds are data measured previously by Schmidtke and Diamond (2000). (B) Log-log plot of the apparent relaxation times for approach to a plateau in tethering force as function of the tether-pulling speed. The solid line is an inverse power law fit to the BFP data defined by, τ ≈ 0.3 s (μm/s / vpull)0.75. (Error bars denote standard deviations.)

