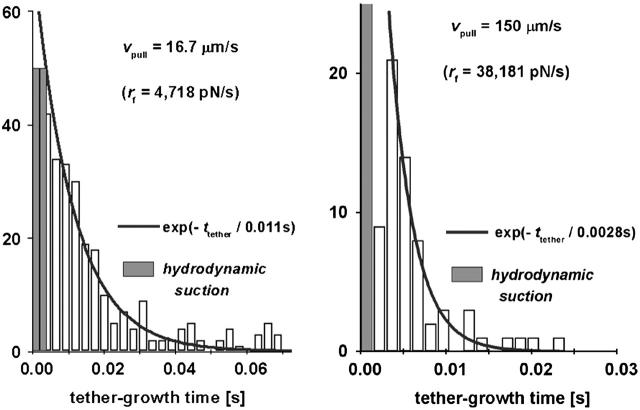
FIGURE 6.
Histograms of tether growth times for two fast pulling speeds. The solid curves are exponentials that best match the data. The time constants listed on each figure are consistent with the dissociation of a monomeric P-selectin bond to PSGL-1 when held at the most frequent force found for membrane separation from the cytoskeleton. (The shaded bins represent the range of observations obscured by nonspecific forces arising from hydrodynamic coupling between the probe tip and the cell surface at fast pulling speeds, discussed in the Materials and Methods section of article I.)

