
FIGURE 5.
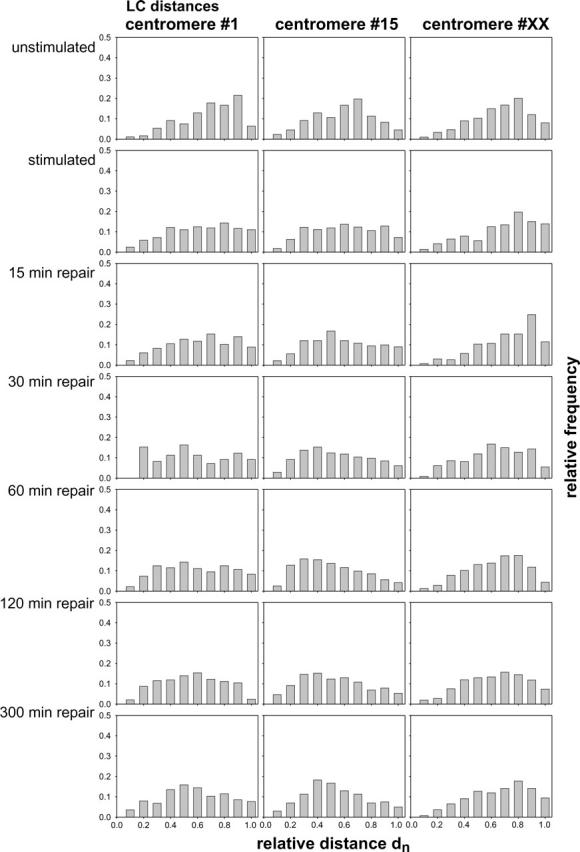
Frequency distributions of LC-distances relative to the diameter of the cell nucleus (dn) for nuclei subjected to the indicated treatments and in the indicated repair states. The individual columns represent the frequency of values in a range of 0.1 dn each.