
FIGURE 6.
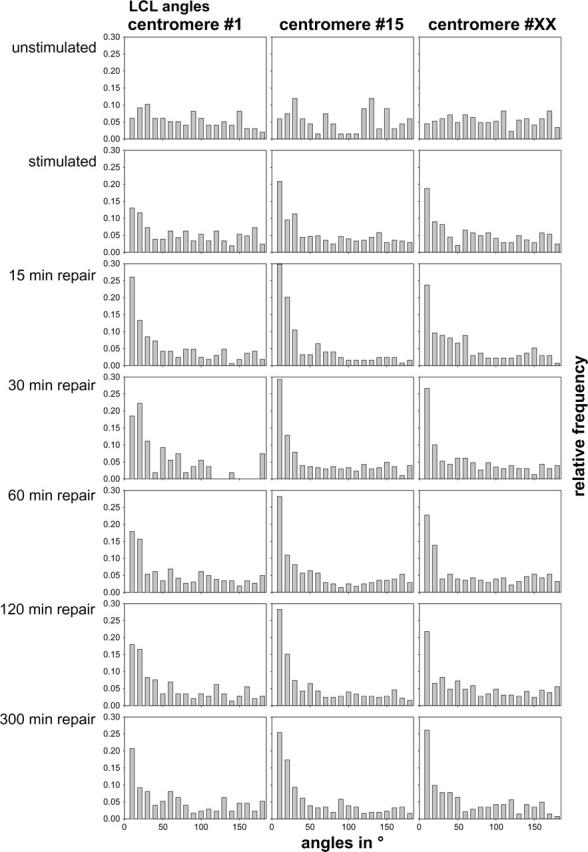
Frequency distributions of LCL-angles for nuclei subjected to the indicated treatments and in the indicated repair states. The individual columns represent the frequency of values in a range of 10° each.
Official websites use .gov
A
.gov website belongs to an official
government organization in the United States.
Secure .gov websites use HTTPS
A lock (
) or https:// means you've safely
connected to the .gov website. Share sensitive
information only on official, secure websites.
Frequency distributions of LCL-angles for nuclei subjected to the indicated treatments and in the indicated repair states. The individual columns represent the frequency of values in a range of 10° each.