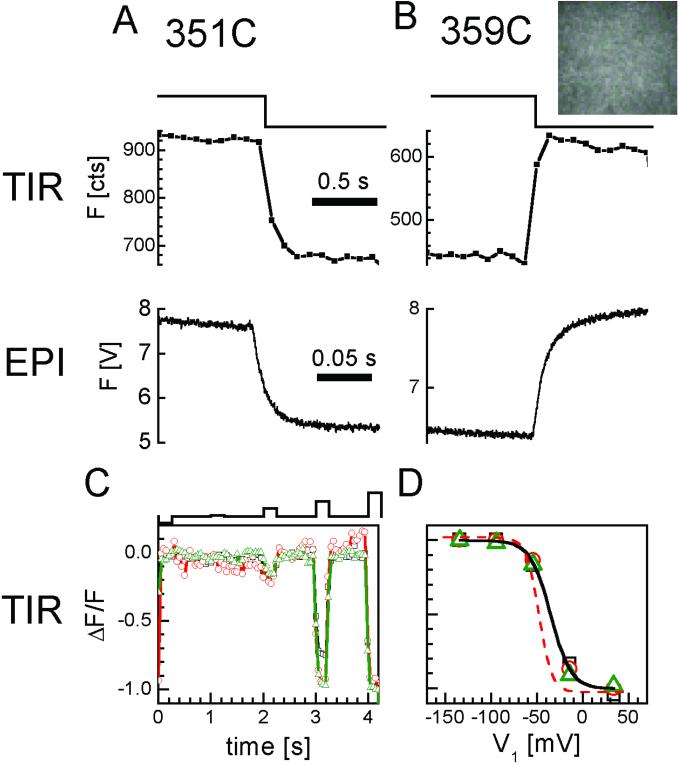
Figure 3.
Optical detection of channel rearrangements in TIR excitation and epi-illumination. (A and B) TMR fluorescence increases at 351 (A) and decreases at 359 (B) in response to depolarization (−100 to +40 mV), under both penetrating epi-illumination (epi) (optical patch of 500-μm diameter; photodetection with a photomultiplier), and evanescent field excitation by TIR illumination (optical patch of 20-μm diameter; photodetection with the CCD at 10 frames per s). (B Inset) CCD image of the 359-TMR optical patch in TIR. (C and D) Good quality voltage clamping of optical patch in evanescent field. (C) Successive voltage steps to different levels (top) from a holding potential of −100 mV to −140, −90, −50, −10, and +30 mV, changes fluorescence over similar voltage ranges for three oocytes. Low TIR illumination intensity (0.1 mW per 20-μm-diameter spot). (20 frames per s.) (D) Comparison between the voltage dependence of fluorescence in TIR compared with epi-illumination. TIR from devitellineized oocytes with the extracellular matrix removed (symbols) fit with single Boltzmann (solid curve). Epi-illumination from oocytes with vitelline and extracellular matrix intact (dashed single Boltzmann fit).

