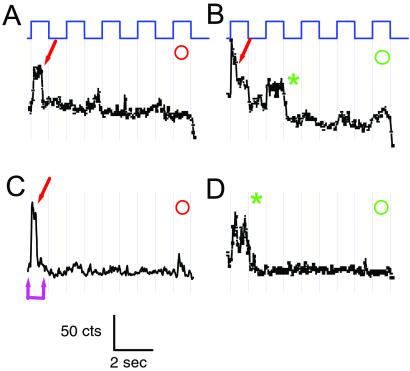
Figure 5.
Elementary ΔF of single TMRM molecules attached to 351C. Trajectories of fluorescence intensity of four spots in one optical patch (y axis range = 270–450 counts) during a 10-s movie (same color code, voltage protocol, imaging and illumination as in Fig. 3). Spots where intensity was modulated by voltage were all brighter at positive voltage, characteristic of 351-TMRM channels. Single channels were identified by quantal bleaching in the bright state (arrows). Dim-state bleaching was also observed (asterisk).

