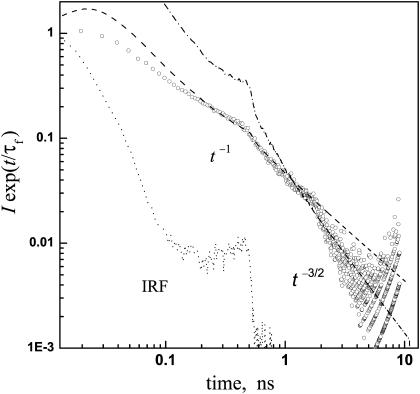
FIGURE 1.
Time-resolved fluorescence from wt-GFP (293 K, in pH = 8 buffer). Circles are experimental data by Leiderman et al. (2004), showing the time dependence of the 450 nm emission intensity, I, corrected for the fluorescence lifetime, τf = 2.4 ns (determined from the decay of the anion emission at 510 nm). These data are from a different experimental run than shown in their Fig. 5, and reproduced here with permission. Dashed and dash-dot lines represent the asymptotic t−1 and t−3/2 laws, respectively, convoluted with the instrument response function (dotted). Both powers-laws were multiplied by the same arbitrary prefactor. Note the log-log scale.

