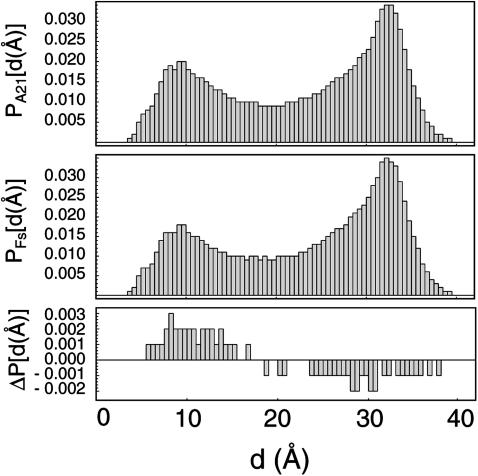
FIGURE 10.
Equilibrium end-to-end distance distributions for A21 (top) and Fs (bottom) under the AMBER-99φ force field at 305 K as measured from the N-acetyl carbon to the C-terminal nitrogen. The difference is shown in the bottom panel, with A21 favoring more collapsed conformations by ∼10% over Fs and Fs favoring more extended conformations. For reference, the ideal helix has an end-to-end distance of ∼31 Å using this measurement.

