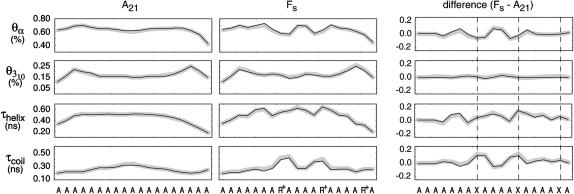
FIGURE 7.
Equilibrium residue properties. From top to bottom are the mean α-helicity, 310 helicity, helix dwell time, and coil dwell time per residue for the A21 (left) and Fs (right) sequences under the AMBER-99φ potential at 305 K. The difference is shown for each ensemble property on the right, with dashed vertical lines representing locations of ARG insertions. The 310-helicity is based on Dictionary of Secondary Structure in Proteins assignments, whereas all other frames are based on LR counting theory. The native and folding ensembles are shown in black and gray, respectively, and highlight the degree of convergence between the ensembles on the residue level.

