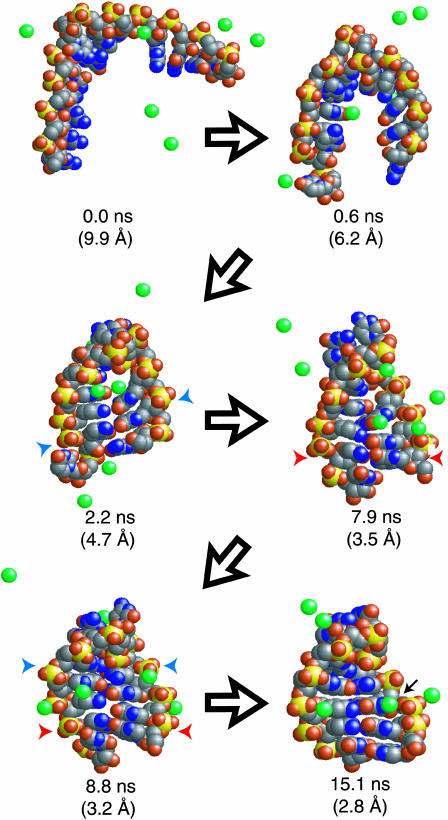
FIGURE 2.
An example of the diverse conformational sampling observed in stem formation is shown. Na+ ions near the solute are shown in green (due to the two-dimensional image, actual ion distances from the solute are not well represented). Blue and red arrows indicate native and non-native basepairing before proper alignment. Initial collapse is complete within ∼2 ns in this trajectory, yet non-native basepairing is present after 8 ns. At ∼15 ns the stem is fully formed, including one site of significant electrostatic potential binding a hydrated ion (black arrow) that was also observed in simulations of the relaxed native structure.

