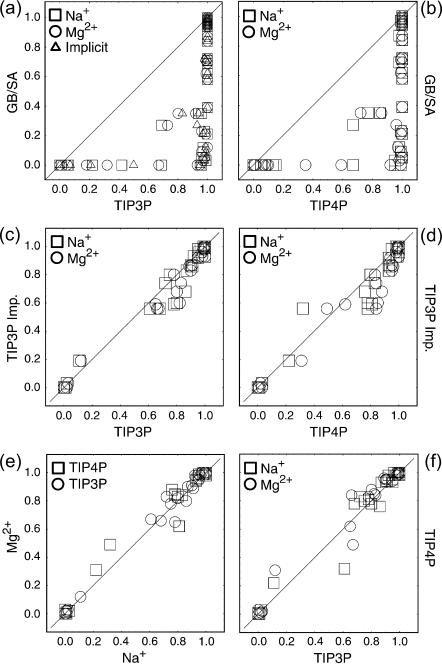
FIGURE 4.
Pfold versus Pfold plots comparing the implicit and explicit solvent and ion models are shown in frames a–d. Each frame combines the Pfold values for both folding pathways previously detected using the GB/SA continuum solvent. Comparisons between TIP3P and TIP4P explicit water models using sodium and magnesium counterions are shown in e and f.

