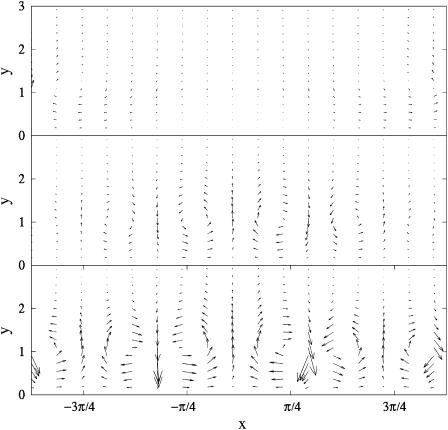
FIGURE 4.
Time series of flow pattern during hole formation. (Top panel) At  random initial conditions produce a small flow. (Middle panel) At
  the bacteria have started to aggregate in three locations. At these locations there is a strong downward flow. In locations where there are fewer bacteria, the return flow dominates the flow produced by the bacteria, setting up circular flow patterns. (Bottom panel) Flow at
  Scaling of arrows in top panel is larger to make the arrows more visible.

